
On-chain data and whale positioning suggest Bitcoin could attempt another breakout, despite short-term technical caution.
At the time of this analysis, Bitcoin is down 2.5% over the past 24 hours. As a result, the asset is trading near $87,500.
The pullback followed buyers’ failure to hold prices above $90,000 the previous day. This confirms that the $90,000 level continues to act as strong resistance.
Still, several factors indicate that this scenario could change in the near term.
Whales Increase Their Bitcoin Exposure
One of the most bullish signals comes from large Bitcoin holders, commonly known as whales. These investors control significant capital. Therefore, their positioning often plays a decisive role in price movements.
According to Glassnode data, the number of wallets holding at least 1,000 BTC has increased meaningfully. Since December 20, this figure has continued to rise, now exceeding 87,000 addresses.
Whale behavior in derivatives markets also reinforces this trend. On Binance futures, the share of large traders holding long positions has been climbing. This metric rose from 63.80% last Friday (19) to approximately 69.16%.
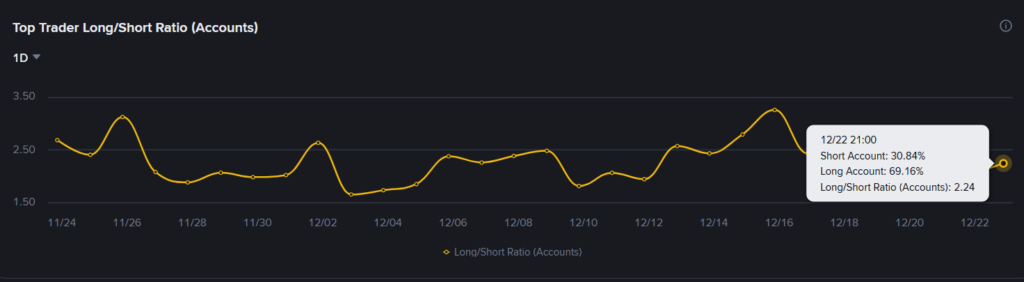
Historically, this type of positioning tends to precede major market moves. After all, whales rarely accumulate without a clear strategy.
Exchange Outflows Ease Selling Pressure
Another key bullish factor comes from Bitcoin flows on exchanges. According to Glassnode, exchange withdrawals surged earlier this week, with more than 41,000 BTC leaving trading platforms.
This figure represents an increase of roughly 60% compared to the previous week’s average. As a result, the data suggests a lower willingness among holders to sell.
Coinglass data supports this trend. Over the past several hours, more BTC has been withdrawn from exchanges than deposited. This imbalance reduces immediate selling pressure.
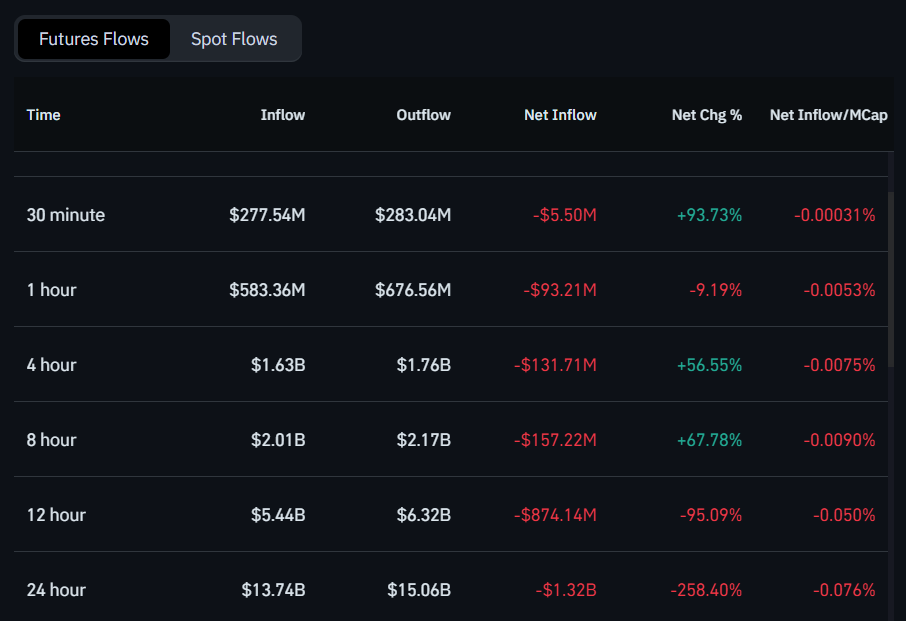
Consequently, buyers may find more room to regain control. With fewer coins available for sale, even modest increases in demand can trigger sharp price moves.
Technical Analysis Still Calls for Caution
Despite the constructive on-chain signals, technical indicators suggest caution remains warranted. On the daily chart, Bitcoin continues to consolidate between $85,000 and $94,500, a range that has held since the second half of November.
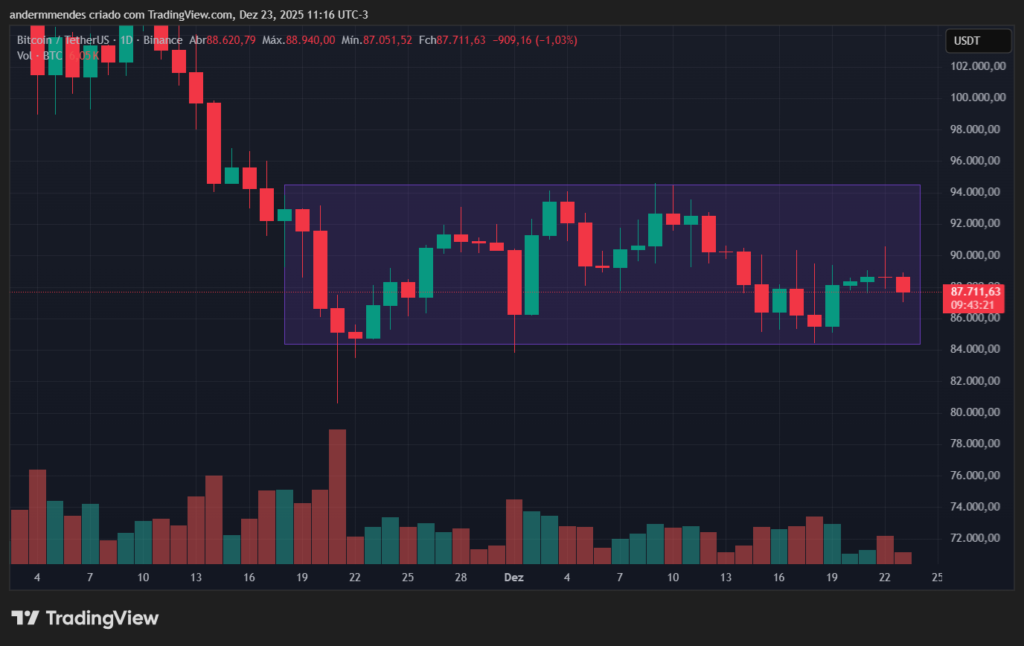
Currently, price action sits in the lower half of this range. Therefore, another test of the $85,000 support level remains possible, even with improving on-chain conditions.
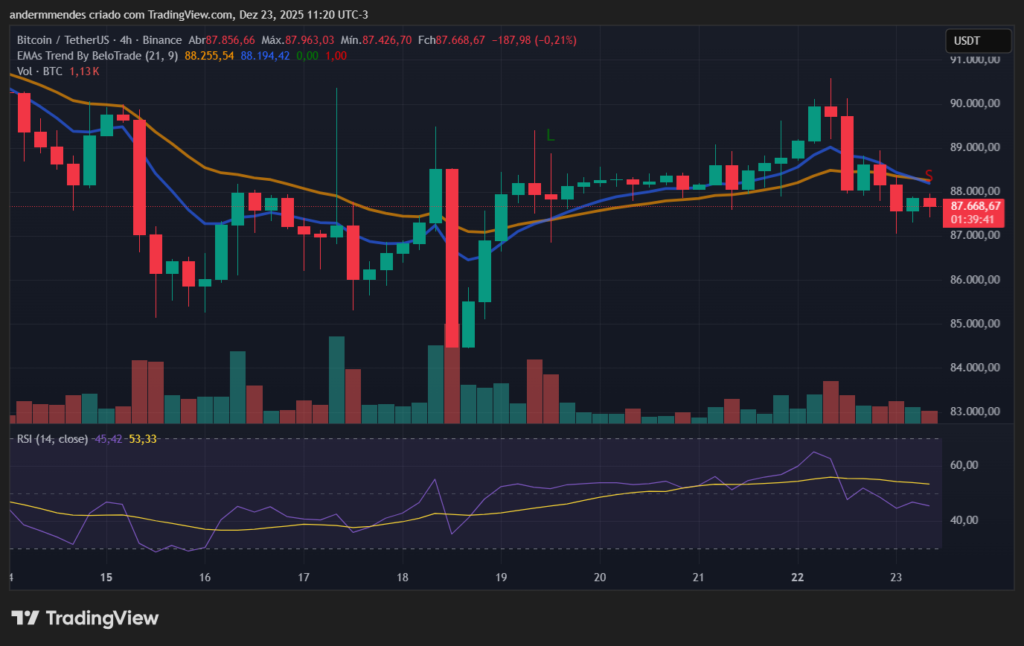
On the 4-hour chart, short-term indicators reinforce this risk. The 9-period EMA has once again crossed below the 21-period EMA. The last time this occurred, Bitcoin dropped toward the $85,000 region.
Additionally, the RSI has fallen back below the 50 level. This signals weakening bullish momentum. As a result, further upside will require clearer confirmation.
In this context, the $87,500 level becomes critical. If this support holds, the market may attempt another push higher. However, Bitcoin must reclaim $90,000 with strong volume to open the door toward $94,500.
For that scenario to materialize, whale accumulation must intensify further. At the same time, exchange outflows need to remain elevated. Otherwise, Bitcoin may continue to trade sideways below $90,000 as the year draws to a close.