
Bitcoin (BTC) entered the final week of January attempting to stabilize after a weekend dominated by selling pressure.
The cryptocurrency established a local bottom near $86,100 on Sunday (25) and has since staged a modest rebound. At the time of writing, BTC is trading around $88,350, reflecting a controlled recovery following recent declines.
Still, the broader structure remains fragile. Market participants continue to weigh the possibility of a short-term trend shift against the risk of renewed downside if resistance levels hold.
For now, Bitcoin sits at a technical crossroads. Buyers are showing early signs of engagement, but the market has yet to deliver confirmation strong enough to invalidate the prevailing corrective structure.
Bitcoin price action faces a decisive technical test
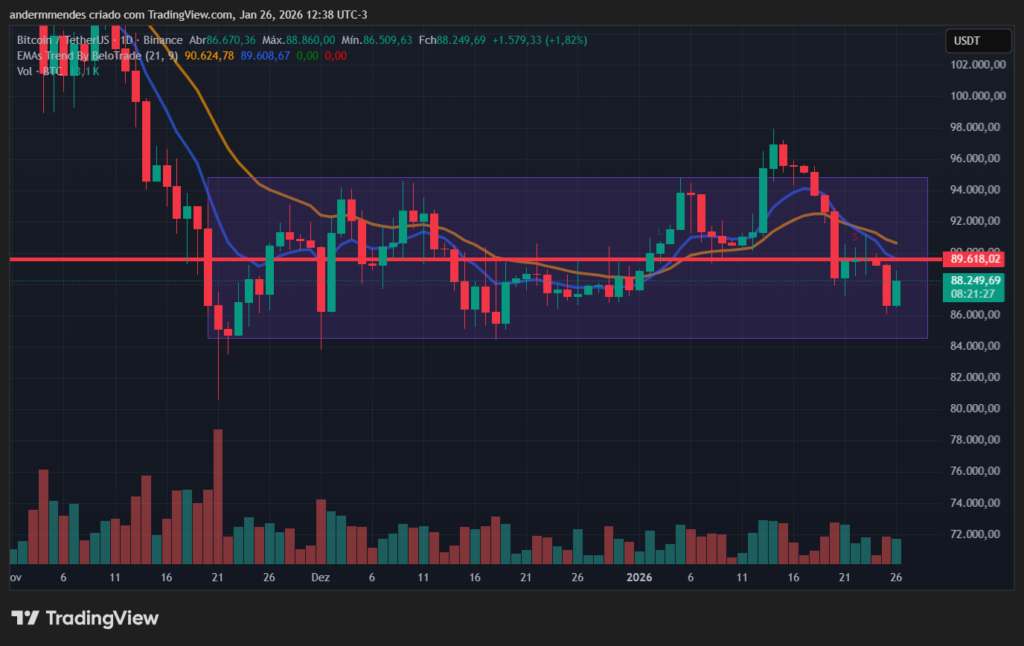
Bitcoin remains locked inside a broad consolidation range between $84,000 and $95,000, a structure that has constrained price movement for several weeks.
On the daily chart, the crossover between the 9-day and 21-day exponential moving averages continues to point to a bearish bias. As a result, the broader market environment remains defensive.
That said, recent price behavior offers some nuance. The latest bounce originated above the lower boundary of the consolidation pattern. This technical detail matters because it signals that buyers defended a critical demand zone rather than allowing price to slide toward deeper support.
On lower timeframes, the two-hour chart reveals the formation of a higher low, a classic early signal of a potential short-term reversal. This structure suggests that selling pressure has weakened, at least temporarily, and that buyers are beginning to absorb supply more efficiently.
The most important resistance level in the near term sits at $89,600. This area marks the upper boundary of the short-term structure and aligns with multiple prior rejections. For Bitcoin to shift into a more constructive technical posture, price must reclaim this zone and hold above it.
Without a confirmed breakout, the current move remains corrective rather than impulsive. A failure near resistance would likely reinforce range-bound conditions and keep volatility elevated.
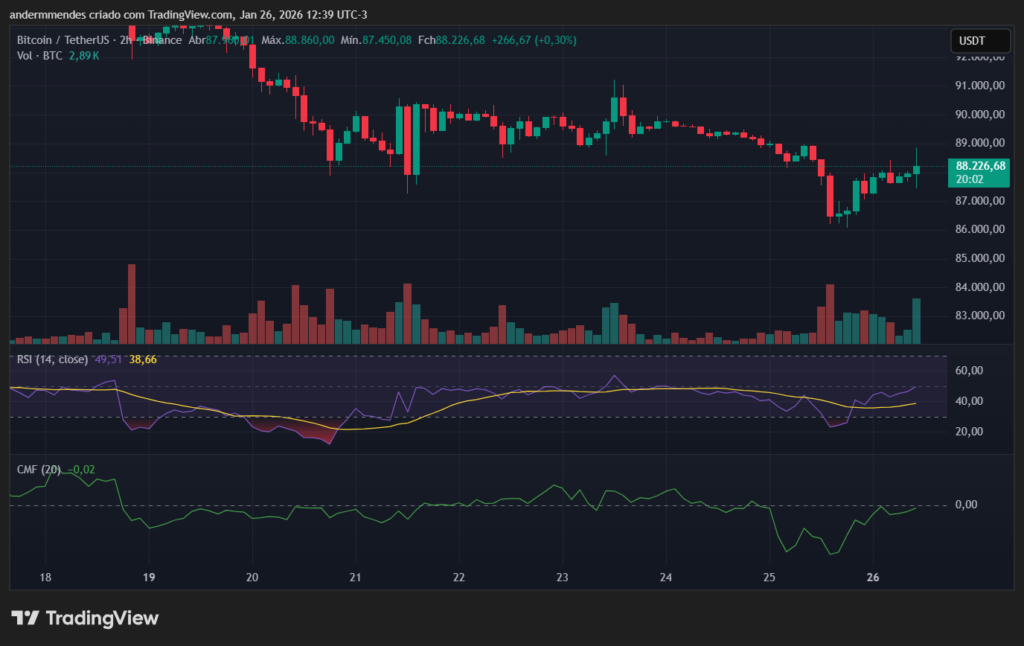
Momentum indicators support this cautious interpretation. The Relative Strength Index (RSI) is approaching the 50 level, which typically separates bullish and bearish momentum. At the same time, the Chaikin Money Flow (CMF) is nearing positive territory, hinting at a possible return of net capital inflows.
If both indicators confirm these shifts, the market may interpret the move as a gradual momentum reversal. Until then, technical confirmation remains incomplete.
On-chain data signals cautious optimism beneath Bitcoin’s range
On-chain metrics add important context to the current technical setup. One notable indicator, Spent Coin Age Bands, which tracks the movement of coins regardless of their holding period, has dropped by more than 70% over the past few days.
This sharp decline suggests a meaningful reduction in on-chain selling activity. When fewer coins move across the network, selling pressure tends to ease. As a result, the market often becomes more receptive to price stabilization or recovery attempts, particularly after corrective phases.
In this environment, recent behavior indicates that many holders are choosing to stay sidelined rather than realize losses. This dynamic reduces immediate supply and gives buyers more room to test higher levels.
Whale activity adds another layer to the analysis. In Bitcoin futures markets on Binance, more than 77% of large trader positions are currently long, marking the highest level recorded so far this year. This positioning is significant because large players often exert disproportionate influence over liquidity and short-term volatility.
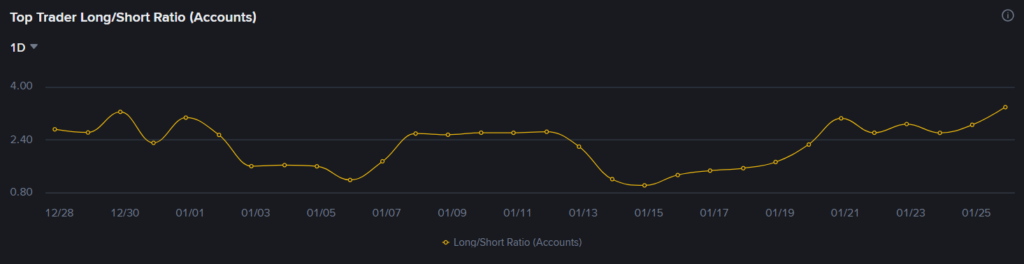
An increase in long exposure among whales suggests expectations of stabilization or a controlled rebound. However, it does not guarantee a sustained upside move. In consolidation phases, large participants frequently adjust positioning for hedging or tactical purposes rather than directional conviction.
For that reason, price action remains the decisive factor. Despite constructive on-chain signals, Bitcoin still needs a clear break above $89,600 to validate a bullish short-term scenario. Only then would a move toward the $95,000 region become technically relevant.
Until such confirmation emerges, the market remains in a state of cautious balance. Optimism exists, but it rests more on improving conditions than on confirmed structural change.
Bitcoin shows early signs of stabilization, including a higher low on lower timeframes. However, confirmation depends on reclaiming key resistance levels.
The $89,600 area marks a major short-term resistance and aligns with prior rejections. A breakout above it would improve the technical outlook.
On-chain data indicates reduced selling activity and increased whale exposure on futures markets, supporting cautious optimism rather than confirmed bullish momentum.