
Bitcoin (BTC) is trading up 0.7% this Thursday (22), approaching the $89,500 area. The move represents a moderate recovery from the previous day’s low near $87,000. Since then, the cryptocurrency has gained roughly 3%, signaling short-term buying interest.
Even so, the advance unfolds within a still-fragile context. The market continues to struggle to sustain prices above $90,000. This behavior raises questions about BTC’s ability to maintain the current move without fresh catalysts.
Bitcoin faces technical resistance
On the daily chart, Bitcoin has returned to trading within the consolidation range between $85,000 and $94,000. This zone has capped price action since late November and continues to concentrate a large share of trading volume. As a result, it remains a key reference for the market in the short term.
At present, BTC is trading near the middle of this range. In this setup, the technical structure points to a higher probability of a revisit to the $85,000 support than to an immediate upside breakout.
This bias gains traction from the behavior of exponential moving averages (EMAs). The 9-day EMA is approaching a bearish crossover below the 21-day EMA on the daily chart.
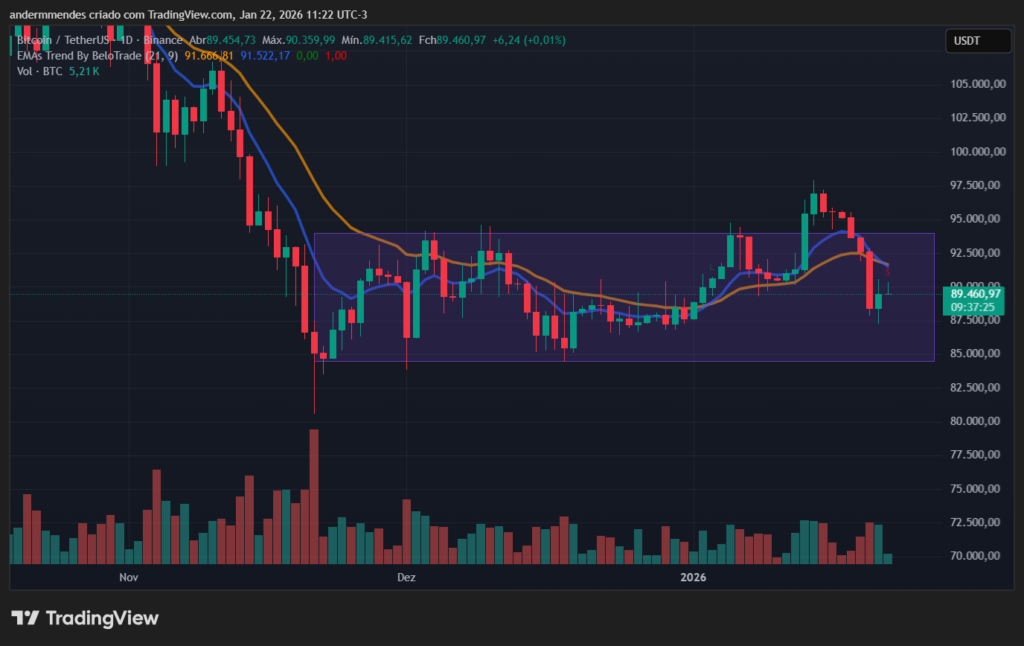
In technical analysis, this signal often indicates trend weakening and rising selling pressure. The last time this pattern appeared, Bitcoin quickly retreated toward the $85,000 region.
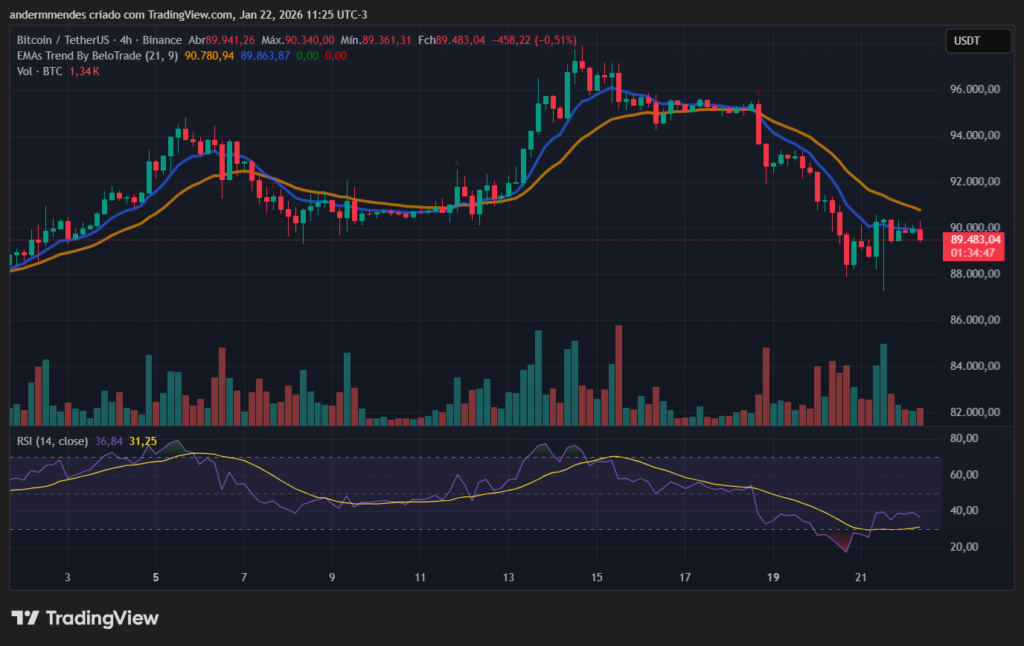
The four-hour chart reinforces this view. On that timeframe, the bearish crossover between the EMAs has already been confirmed, suggesting continuation of the corrective move in the short term. In addition, the RSI remains below the 50 level, indicating that sellers still control momentum.
Bitcoin faces on-chain pressure as supply emerges on recoveries
On-chain data helps explain Bitcoin’s difficulty in holding higher price levels. The Realized Loss by Age indicator from Glassnode shows that realized losses are concentrated among holders with positions aged three to six months. There is also a meaningful contribution from investors holding for six to twelve months.
These cohorts tend to sell during early recovery phases. This behavior creates excess supply near key levels, especially around resistance zones. As a result, price struggles to build enough momentum to break through these barriers.
This pattern helps explain why recent upside attempts have stalled before gaining traction. Whenever BTC approaches higher levels, part of this group uses the move to reduce exposure. Consequently, the market faces structural resistance, not just technical resistance.
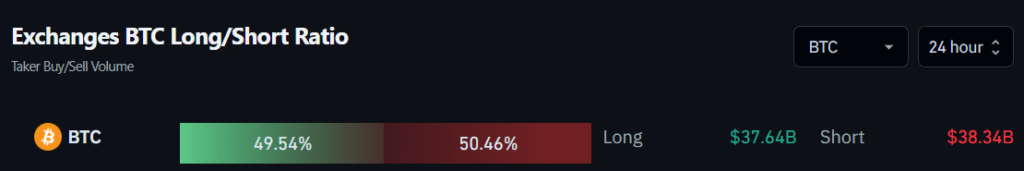
Data from Coinglass supports this interpretation. Over the past 24 hours, sell orders exceeded buy orders by roughly $700 million across major exchanges. This imbalance points to short-term selling dominance.
ETF outflows increase institutional caution
Another relevant short-term factor involves flows from spot Bitcoin ETFs. This week, these products have recorded consistent outflows, totaling around $1.6 billion so far.
On Wednesday (21) alone, redemptions reached $708 million, marking the largest single-day outflow since November 2025. This figure suggests a notable decline in institutional risk appetite, especially as price attempts to stabilize above key levels.
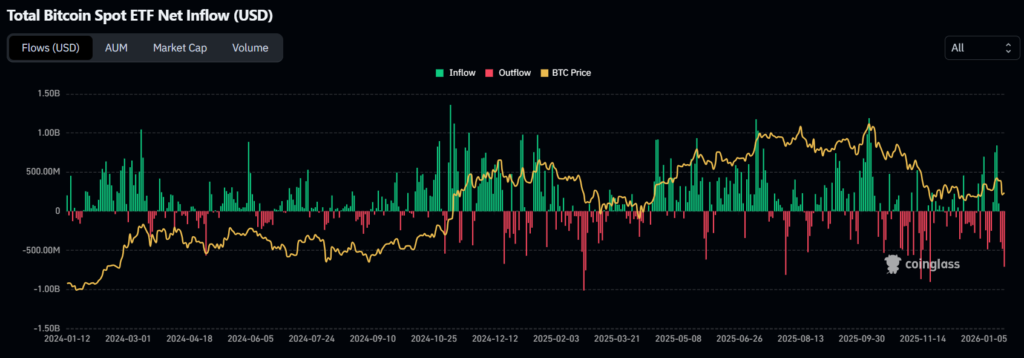
As long as this negative flow persists, Bitcoin is likely to face additional challenges in overcoming the $90,000 barrier. Taken together, price action, on-chain metrics, and institutional flows point to a cautious market environment. In this context, the setup favors sideways movement or deeper corrective phases in the short term.
Bitcoin faces a mix of technical resistance, selling pressure from mid-term holders, and reduced institutional demand from ETFs.
On-chain data shows realized losses concentrated among recent holders, who tend to sell into recoveries, limiting upside momentum.
ETF outflows reduce passive institutional demand, making it harder for Bitcoin to sustain moves above key resistance levels.