
Ethereum (ETH) slipped back into the red on Wednesday (7), snapping a six-day winning streak. The pullback raises fresh questions about ETH’s near-term direction, especially after such a strong run.
Over the past 24 hours, Ethereum dropped around 3%. At the time of writing, ETH was trading near $3,170, according to CoinGecko data.
So far, this move still looks like a healthy correction. After all, ETH rallied roughly 10% since last Thursday (1).
That said, whale behavior suggests the downside risk may not be fully priced in yet.
Ethereum whales turn sellers and increase pressure
Large Ethereum holders have shifted into sell mode as price pushed higher. Many appear to be taking advantage of the recent momentum to lock in profits rather than chase further upside.
According to Santiment, wallets holding between 100,000 and 1 million ETH sold close to 300,000 ETH over the past three days alone. At current prices, that translates to roughly $970 million worth of selling pressure entering the market.
This is not a trivial amount. Flows of this size can materially impact supply-and-demand dynamics, especially in the short term. Unsurprisingly, order flow data confirms that sellers currently dominate.
Over the past 24 hours, bearish orders outweighed bullish ones by more than $800 million, based on Coinglass data.
When sell-side pressure overwhelms buy-side demand, the market struggles to hold elevated levels. Price usually responds by seeking lower liquidity zones.
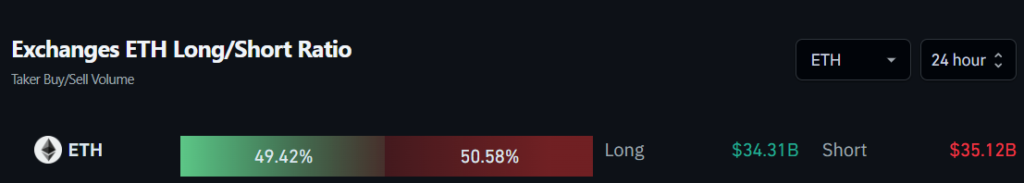
Derivatives positioning tells a similar story. On Binance, only 58.86% of large traders are currently net long ETH futures. While longs are still in the majority, the decline is notable. At the start of Ethereum’s last major rally late last year, this figure stood at 76.06%.
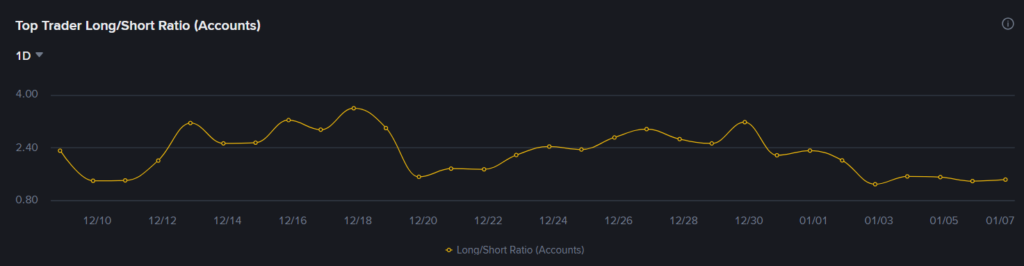
In other words, big players are clearly dialing back their risk exposure.
Technical analysis signals room for further downside
The daily chart also calls for caution. Ethereum failed to break above the $3,320 resistance zone, a level that has capped price multiple times. As a result, ETH may now be forming a classic double-top structure.
Price action also respected the upper Bollinger Band, often a sign of short-term exhaustion. From here, ETH could rotate toward the midline or even the lower band of the indicator.
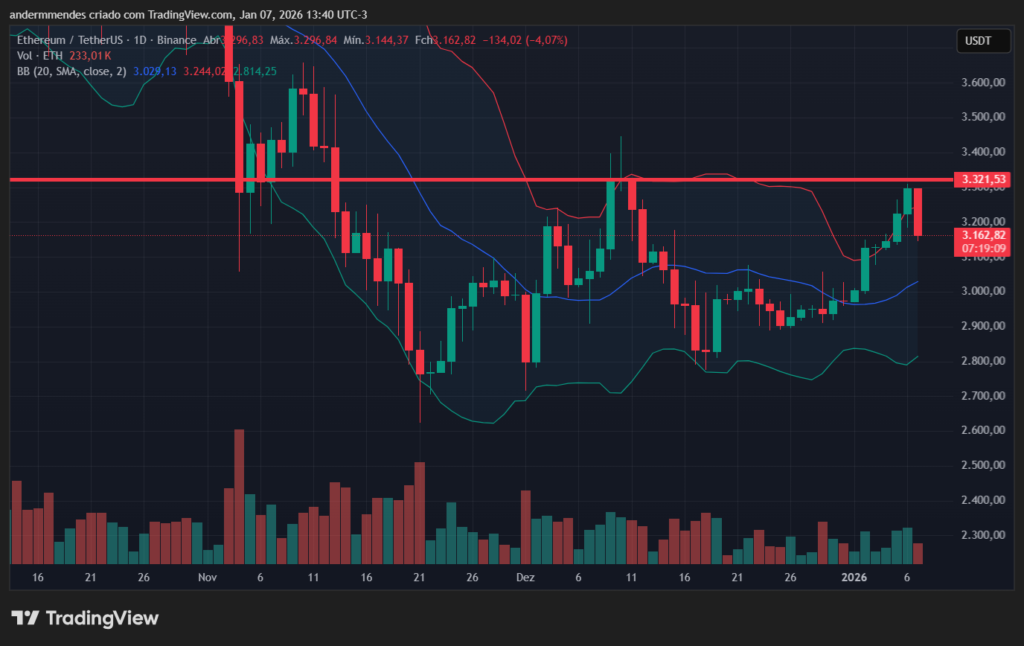
Bollinger Band projections currently point to potential downside targets around $3,030 and $2,815. If price follows this path, the correction could exceed 10% from current levels.
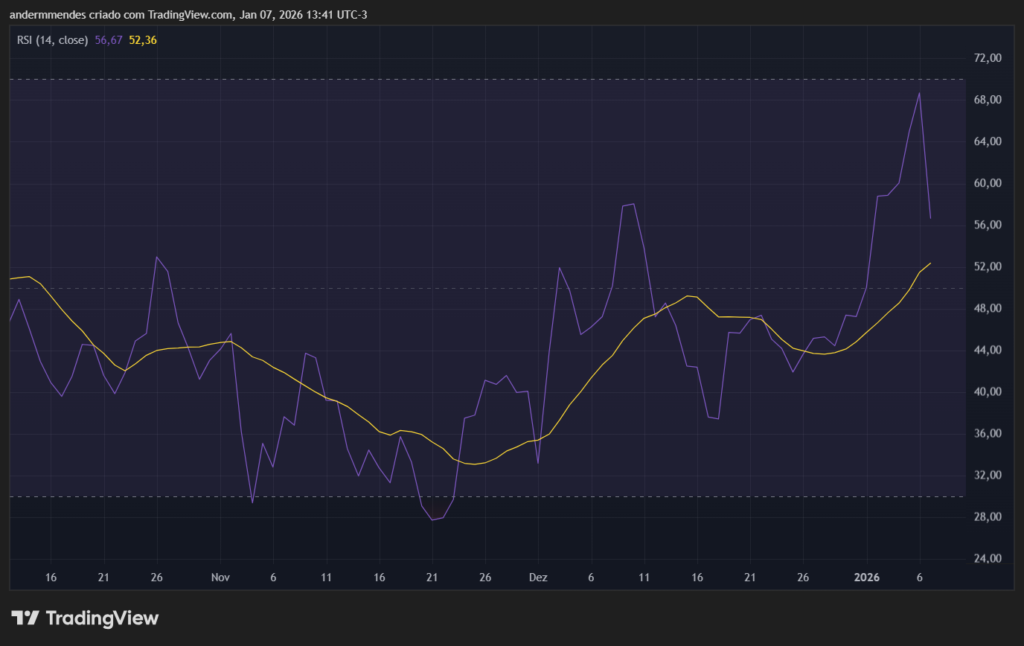
Momentum indicators back up this bearish bias. The daily Relative Strength Index (RSI) rolled over sharply after approaching overbought territory. A decisive move below the neutral 50 level would strengthen the case for continued downside.
For short-term traders, this combination of structure, momentum, and order flow argues for caution.
Is there still hope for Ethereum bulls?
Despite near-term risks, the weekly chart still offers a more constructive picture. On higher timeframes, Ethereum remains structurally bullish, at least for now.
For that bullish scenario to stay alive, buyers must clear a key hurdle. The 0.236 Fibonacci retracement level, located near $3,180, stands as an important resistance. A clean break above this zone could shift sentiment quickly.
If bulls regain control, ETH could enter a broader corrective expansion to the upside. In that case, the next technical targets sit near the 0.5 and 0.618 Fibonacci levels. These zones are widely used as upside objectives in trend continuation or recovery setups.
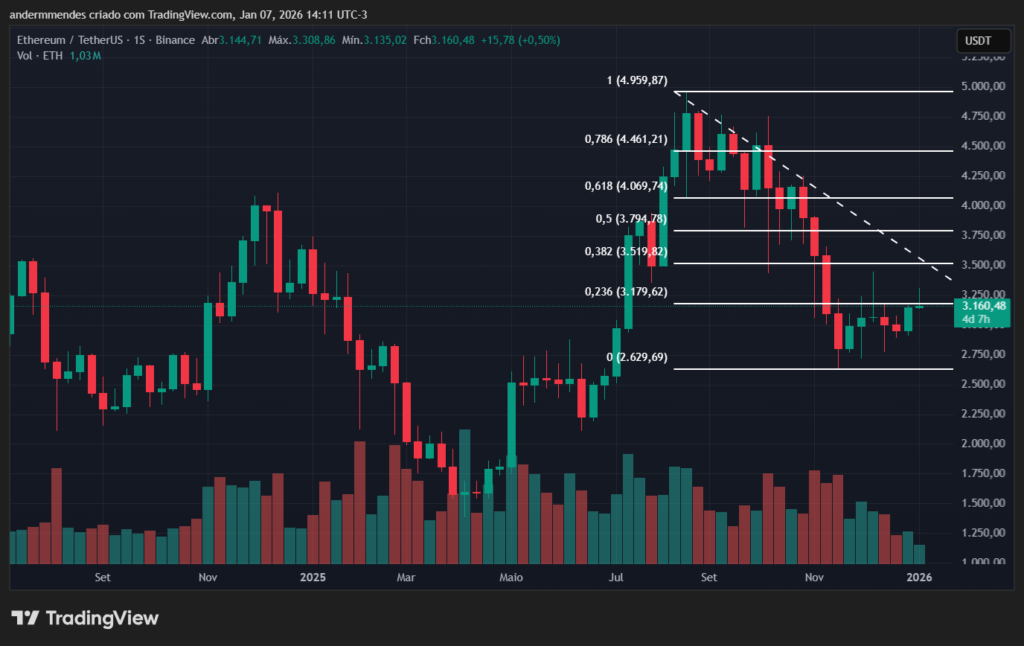
Under this projection, Ethereum could rally toward the $4,069 area. That would represent a potential upside of roughly 28% from current prices.
However, this bullish outcome remains unlikely as long as whales continue to offload their holdings. Sustained distribution from large wallets tends to cap rallies and weaken follow-through. Until that changes, Ethereum may remain vulnerable to deeper pullbacks before any meaningful continuation higher.
Ethereum whales are likely taking profits after a strong six-day rally. As price approached key resistance levels, large holders chose to reduce exposure, increasing sell-side pressure and weakening short-term momentum.
Not necessarily. Heavy whale selling often leads to short-term corrections, especially when demand weakens. However, broader market structure and higher-timeframe trends still matter for Ethereum’s medium- to long-term outlook.
On the downside, traders are watching support near $3,030 and $2,815. On the upside, a break above the $3,180 Fibonacci resistance could reopen the path toward the $4,000 region.